In the Pa. Suburbs, Changing Demographics Favor Democrats
Since 2000, the Pennsylvania suburban counties of Philadelphia have become increasingly more diverse and better educated, trends that favored Democratic congressional candidates in this month’s elections.

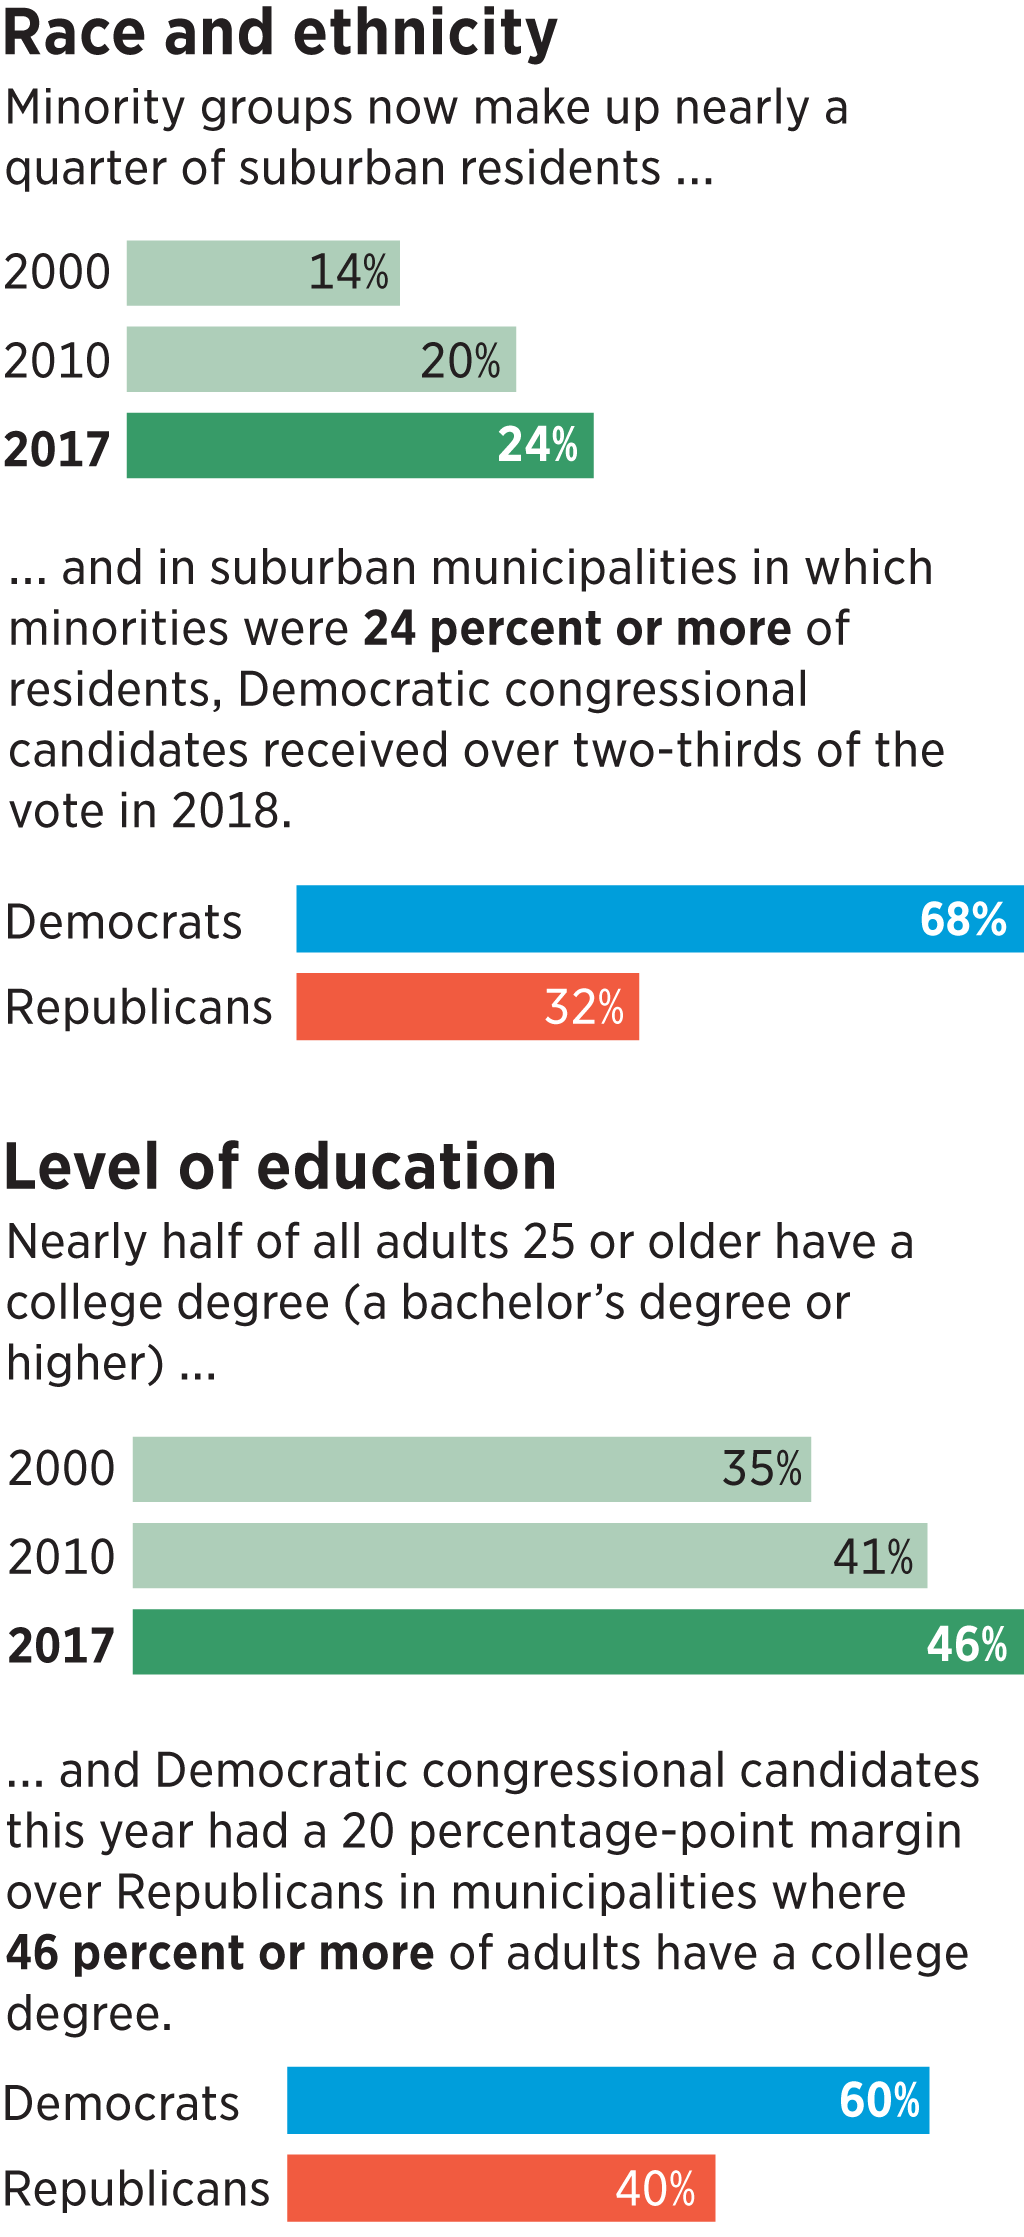
Race and ethnicity
Level of education
Minority groups now make up nearly a quarter of suburban residents ...
Nearly half of all adults 25 or older have a college degree (bachelor’s degree or higher) ...
2000
14%
2000
35%
2010
20%
2010
41%
24%
46%
2017
2017
... and in suburban municipalities in which minorities were 24 percent or more of residents, Democratic congressional candidates received over two-thirds of the vote in 2018.
... and Democratic congressional candidates this year had a 20 percentage-point margin over Republicans in municipalities where
46 percent or more of adults have a college degree.
68%
60%
Democrats
Republicans
Democrats
Republicans
32%
40%

Race and ethnicity
Minority groups now make up nearly a quarter of suburban residents ...
2000
14%
2010
20%
24%
2017
... and in suburban municipalities in which minorities were 24 percent or more of residents, Democratic congressional candidates received over two-thirds of the vote in 2018.
68%
Democrats
Republicans
32%
Level of education
Nearly half of all adults 25 or older have a college degree (a bachelor’s degree or
higher) ...
2000
35%
2010
41%
46%
2017
... and Democratic congressional candidates this year had a 20 percentage-point margin over Republicans in municipalities where
46 percent or more of adults have a college degree.
60%
Democrats
Republicans
40%