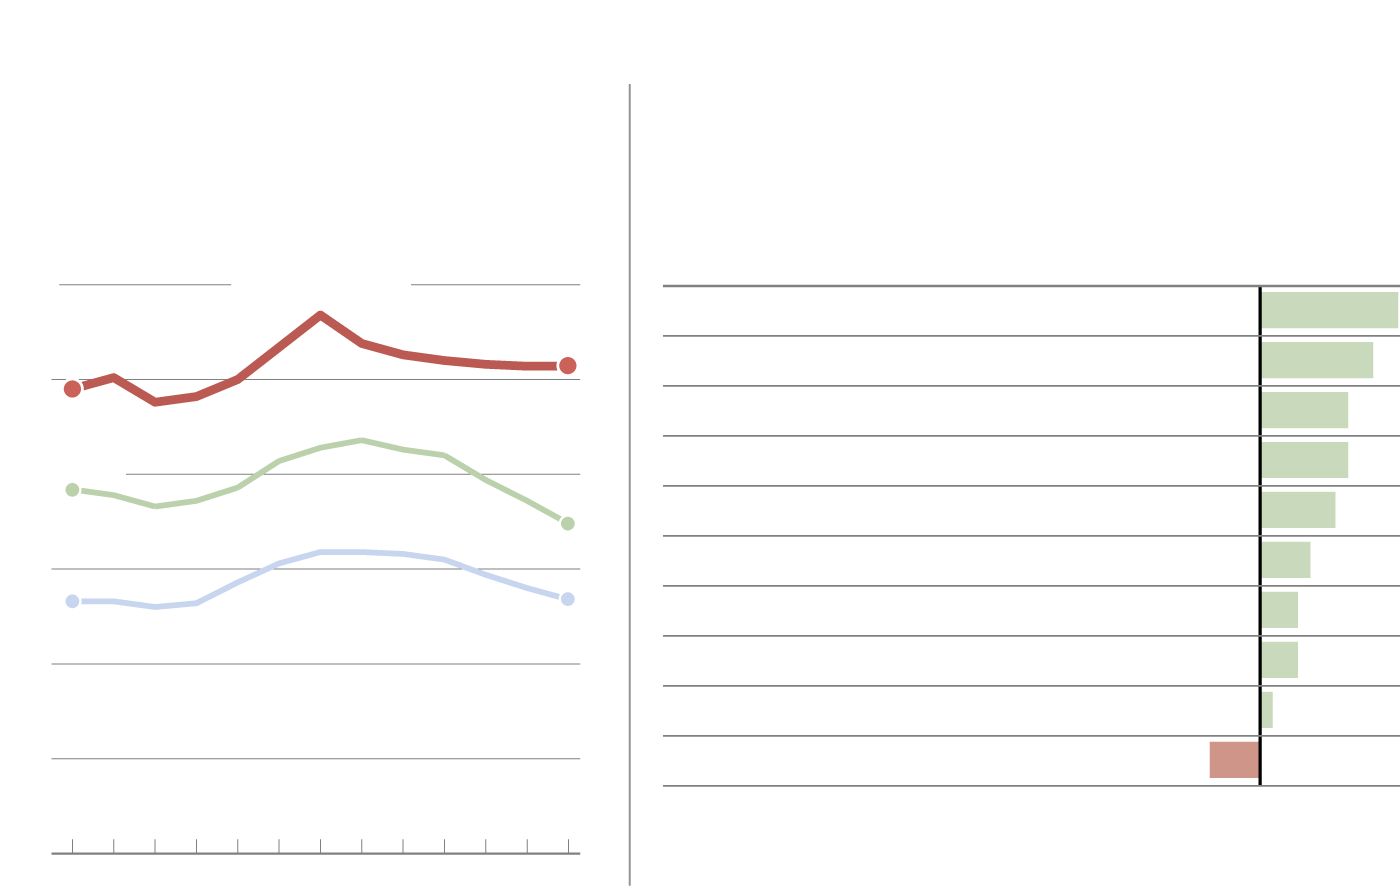
Philadelphia Falls Further Behind
Philadelphia remains the nation’s poorest large city, with a poverty rate that has barely moved in recent years, compared with other top-10 cities and the national rate …
… and Philadelphia was the only large city with a decline in median household income from 2016 to 2017.
City
2016
2017
Pct. chg.
30%
Philadelphia
Los Angeles
$54,432
$60,197
+11%
25.7%
Phoenix
$52,062
$56,696
24.5%
+9%
25
San Diego
$71,481
$76,662
+7%
Avg. of other top-10 cities
+7%
Dallas
$47,243
$50,627
19.2%
20
17.4%
Houston
$47,793
$50,896
+6%
U.S. average
Chicago
$53,006
$55,295
+4%
15
New York
$58,856
$60,879
+3%
13.4%
13.3%
+3%
San Jose
$101,940
$104,675
10
San Antonio
$49,268
$50,004
+1%
–4%
Philadelphia
$41,449
$39,759
5
0
SOURCE: U.S. Census Bureau, 2017 1-year
American Community Survey
’05
’06
’07
’08
’09
’10
’11
’12
’13
’14
’15
’16
’17
Staff Graphic
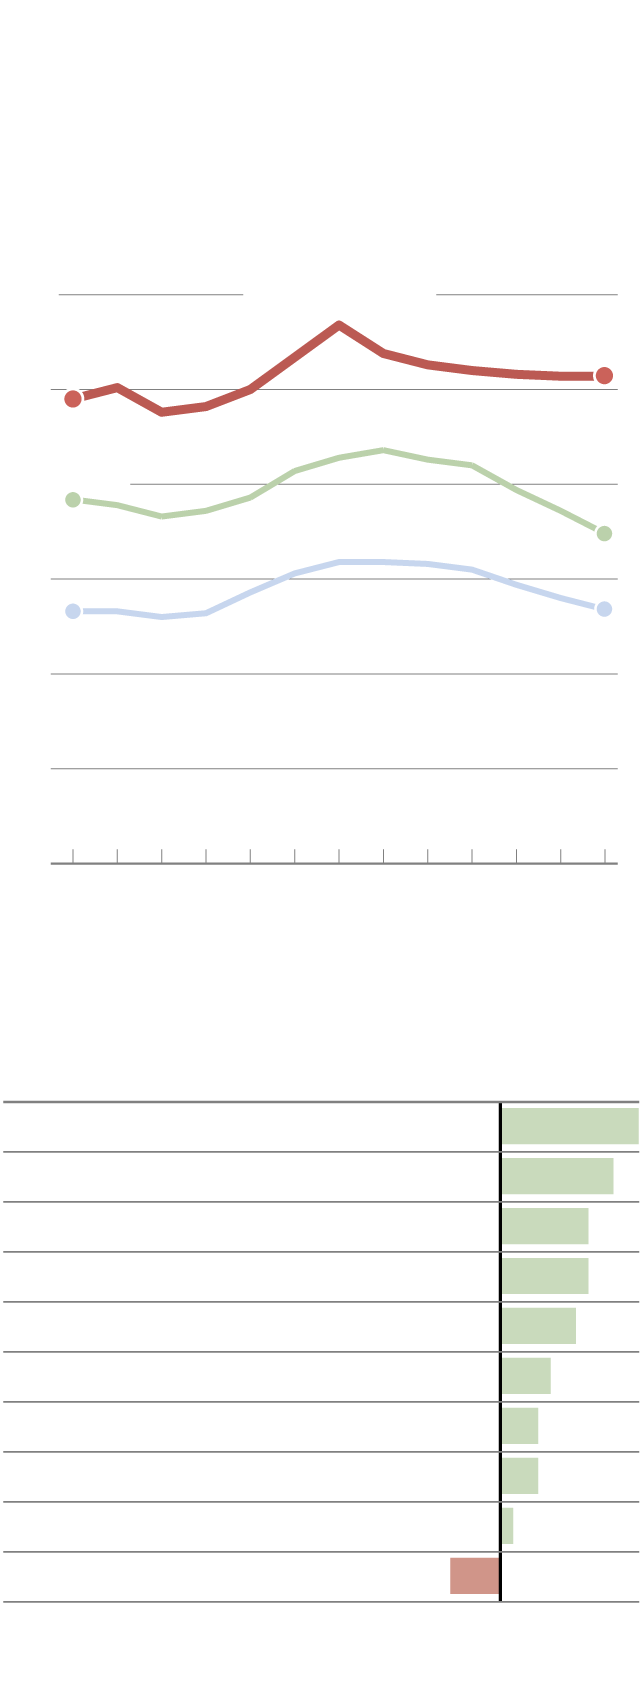
Philadelphia Falls
Further Behind
Philadelphia remains the nation’s poorest large city, with a poverty rate that has barely moved in recent years, compared with other top-10 cities and the national rate …
30%
Philadelphia
25.7%
24.5%
25
Avg. of other top-10 cities
19.2%
20
17.4%
U.S. average
15
13.4%
13.3%
10
5
0
’05
’06
’07
’08
’09
’10
’11
’12
’13
’14
’15
’16
’17
… and Philadelphia was the only large city with a decline in median household income from 2016 to 2017.
Pct. chg.
City
Los Angeles
Phoenix
San Diego
Dallas
Houston
Chicago
New York
San Jose
San Antonio
Philadelphia
2016
$54,432
$52,062
$71,481
$47,243
$47,793
$53,006
$58,856
$101,940
$49,268
$41,449
2017
$60,197
$56,696
$76,662
$50,627
$50,896
$55,295
$60,879
$104,675
$50,004
$39,759
+11%
+9%
+7%
+7%
+6%
+4%
+3%
+3%
+1%
–4%
SOURCE: U.S. Census Bureau, 2017 1-year
American Community Survey
Staff Graphic
